When I first encountered Boom and Crash indices on Deriv, their unique behavior intrigued me. Unlike traditional forex pairs, these synthetic indices offered predictable spikes—Boom indices with sudden upward movements and Crash indices with sharp downward drops.
This predictability, combined with 24/7 availability, made them particularly appealing to traders in regions like South Africa, Nigeria, Zimbabwe, Kenya, and Botswana.
However, navigating these indices wasn’t straightforward initially. Understanding their mechanics, optimal trading times, and effective strategies required a steep learning curve. There were a lot of blown accounts along the way.
In this guide, I’ll share insights on how to trade Boom and Crash indices effectively, drawing from personal experience and industry best practices.
What are Boom & Crash Indices From Deriv?
Boom and Crash indices are synthetic instruments offered exclusively by Deriv. They simulate market conditions with regular spikes upward and downward.
- Boom Indices: Characterized by sudden upward spikes.
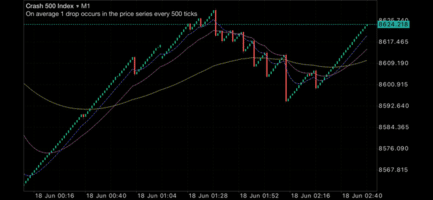
- Crash Indices: Marked by abrupt downward drops.
In other words, they behave specifically like a rising (booming) or falling (crashing) financial market.
📊 Types of Boom and Crash Indices Offered by Deriv
Deriv provides a range of Boom and Crash indices, each designed to simulate specific market behaviors. These synthetic indices are characterized by their unique tick intervals, indicating the average frequency of spikes or drops.
Boom Indices
| Index | Average Spike Interval |
|---|---|
| Boom 300 Index | Every 300 ticks |
| Boom 500 Index | Every 500 ticks |
| Boom 600 index (new) | Every 600 ticks |
| Boom 900 Index (new) | Every 900 ticks |
| Boom 1000 Index | Every 1000 ticks |
Crash Indices
| Index | Average Drop Interval |
|---|---|
| Crash 300 Index | Every 300 ticks |
| Crash 500 Index | Every 500 ticks |
| Crash 600 Index (new) | Every 600 ticks |
| Crash 900 Index (new) | Every 900 ticks |
| Crash 1000 Index | Every 1000 ticks |
Each index offers different trading opportunities based on its volatility and spike/drop frequency.
For instance, the Boom 300 and Crash 300 indices provide more frequent spikes and drops, making them suitable for traders looking for more active trading scenarios.
Conversely, the Boom 1000 and Crash 1000 indices have less frequent but potentially more significant movements, appealing to traders who prefer longer-term positions.
Understanding the characteristics of each index can help you select the one that aligns best with your trading strategy and risk tolerance.
🆕 What’s New with Boom 600 & Boom 900?
These indices were introduced to fill the gap between existing options, offering traders more nuanced control over volatility and spike frequency. They are currently available on the Deriv cTrader platform, providing an alternative for traders seeking different trading experiences .
⚠️ Important Considerations
- Platform Availability: Boom 600 and Boom 900 are currently exclusive to the Deriv cTrader platform. They may not be available on other platforms like MT5 or Deriv X at this time .
- Trading Strategy: Due to their unique spike intervals, these indices may require adjustments to your trading strategy. It’s advisable to test them on a demo account before committing real funds.
🔍 Key Characteristics of Boom & Crash Indices
Boom and Crash indices have some unique traits that set them apart from forex pairs or even other synthetic indices. Here’s what makes them stand out:
- They Move in Ticks, Not Pips
Each price move is measured in ticks — the smallest possible price change. These fast tick-based movements make them ideal for precision entries and scalping. - Volatile by Design
Expect sharp spikes (Boom) or drops (Crash) that can play out in seconds. This volatility is a double-edged sword — it creates big opportunities, but also demands tight risk control. - 100% Synthetic, 100% 24/7
Boom and Crash indices aren’t tied to real-world news or assets. They’re powered by Deriv’s random number generator, which means you can trade them any time, any day, with no surprises from politics or NFP reports.
🧠 If you love fast setups and don’t want to wait for markets to open, Boom & Crash could be the perfect fit.
Boom and Crash Brokers: Your Options Explained
🔹 Deriv – The Original and Exclusive Provider
Deriv is the sole broker that has consistently offered the original Boom and Crash indices — including Boom 300, 500, 1000 and Crash 300, 500, 1000 — for over five years. These synthetic markets simulate real market behavior with predictable spikes (Boom) and drops (Crash), and they’re what put Deriv on the map.
Their reliability, 24/7 trading, and clean platform make them the torchbearers in this space. Every other broker offering similar products is essentially trying to replicate Deriv’s success.
If you want the real Boom and Crash experience, this is where it started — and where it’s still strongest.
🔹 Weltrade – Offering Similar Synthetic Indices (New)
For traders exploring alternatives, Weltrade has introduced Pain X 400 and Gain X 400 — synthetic indices that mimic the spike/drop behavior of Boom and Crash.
But it’s worth noting:
These are relatively new instruments, and like others before them, they could fade out over time. Several brokers have tried to replicate Deriv’s synthetic model before — most haven’t lasted.
That’s why I recommend treating such offerings with caution. They may be good for experimentation, but they don’t have the proven history or consistency that Deriv provides.
You can checkout Weltrade here.
🧾 How to Open a Boom & Crash Trading Account on Deriv
If you’re new to Deriv and want to trade Boom and Crash indices, getting started is simple — but you need to choose the correct account type and platform. Here’s how to do it step by step:
✅ Step 1: Create a Free Deriv Account
Go to 👉 The Deriv Sign_Up page and sign up using your email, Google, or Facebook.
You’ll receive a confirmation email — verify your account to proceed.
✅ Step 2: Open a Financial MT5 Account
From your Deriv dashboard (called Trader’s Hub), choose “DMT5” and open a Financial account.
⚠️ Note: Boom and Crash indices are now under the Financial account, not a separate “Synthetic” account like before.
✅ Step 3: Download the MT5 App
You can trade on MetaTrader 5 via:
- Desktop (Windows/Mac)
- Mobile app (Android/iOS)
- WebTrader (browser-based)
Get the app from your Trader’s Hub or search “MetaTrader 5” on your device’s store.
✅ Step 4: Login to MT5
Use the login credentials (not your email) provided under your Financial account.
Server name: Deriv-Server
Copy and paste your login + password into MT5 and connect.
🧠 Once you’re in, search for “Boom” or “Crash” in Market Watch to add the indices to your chart.
📘 Want help placing your first trade, setting stops, or adding indicators?
👉 Read: How to Trade Synthetic Indices on MT5

⚖️ Minimum Lot Sizes for Boom & Crash Indices
Lot size controls how much you’re risking per trade — and with Boom & Crash indices, Deriv has a fixed minimum you need to know before opening a position.
Here’s the breakdown:
| Boom Index | Crash Index | Minimum Lot Size |
|---|---|---|
| Boom 300 Index | Crash 300 Index | 0.20 |
| Boom 500 Index | Crash 500 Index | 0.20 |
| Boom 1000 Index | Crash 1000 Index | 0.20 |
🧠 Keep in mind: These minimums apply whether you’re using a demo or live account. Always double-check your lot size before hitting Buy or Sell — especially on mobile, where mistakes are easier to make.
👉 Want to understand how lot size affects your risk and stop loss?
Check out our full guide here: Lot Sizes for Synthetic Indices
💰 Minimum Deposit & Margin Requirements for Boom & Crash Indices
While Deriv lets you deposit as little as $1, let’s be honest — you won’t get far trading Boom and Crash indices with that.
Why? Because the margin requirements (the money locked to open a trade) and minimum lot sizes don’t allow it. Boom and Crash start from 0.20 lots, which means you need at least a few dollars in your account just to enter a trade — and even more to survive any drawdown.
Here’s a quick breakdown of what you actually need to trade comfortably:
| Index | Margin (0.20 lot) | Recommended Minimum Balance |
|---|---|---|
| Boom 1000 Index | $6.01 | $10+ |
| Boom 500 Index | $2.51 | $5+ |
| Crash 1000 Index | $3.53 | $5+ |
| Crash 500 Index | $3.72 | $5+ |
🧠 Reality Check:
If your balance is under $5, you won’t be able to open most Boom/Crash trades — even if you’re using perfect entries. Always give yourself enough room to breathe.
📘 Want to learn how to grow a $10 account using Boom & Crash?
Check out our guide: How To Grow A Small Account Using Boom & Crash

📏 How to Calculate Ticks on Boom and Crash Indices
Ticks are the smallest price movements on Boom and Crash indices — and understanding how to calculate them is key to measuring your trade precision, stop loss, and profit targets.
🔢 What Is a Tick?
On Deriv’s Boom and Crash indices, 1 tick = 0.01. So every time the price moves by 0.01, that’s considered one tick.
🧠 Step-by-Step: Calculating Ticks
Let’s say price moved from 1000.50 to 1001.00 — how many ticks is that?
- Find the total movement:
1001.00 – 1000.50 = 0.50 - Use the tick value:
1 tick = 0.01 - Do the math:
0.50 ÷ 0.01 = 50 ticks
✅ So, a 0.50 move equals 50 ticks.
📌 Why This Matters
Knowing tick movement helps you:
- Set accurate stop loss and take profit levels
- Understand your risk in points vs dollar terms
- Avoid oversized trades, especially on small accounts
🔗 Want to go deeper into lot sizes and dollar per tick?
👉 Check out our full guide: Lot Sizes for Synthetic Indices
✅ Pros and Cons of Trading Boom & Crash Indices
Boom and Crash indices are arguably the most popular synthetic instruments on Deriv — and for good reason. But like all markets, they have strengths and weaknesses you need to understand before diving in.
🟢 Advantages of Boom & Crash Trading
- Predictable Price Spikes
Boom and Crash indices are designed to spike in one direction after a set number of ticks (e.g. every 500 or 1000), giving sharp, exploitable moves ideal for scalping. - 24/7 Market Access
You can trade Boom & Crash any day, any time — no weekend closures, no market gaps, no news-based volatility. - Minimal News Interference
Being synthetic, these indices aren’t affected by central banks, politics, or economic reports. This allows for more technical, pattern-based strategies. - Small Account Friendly
Thanks to fixed lot sizes and relatively low margin requirements (especially on Boom 500 / Crash 500), it’s possible to start with $5–$20 and still catch real moves. - Great for Learning Price Action
The clean movement of these indices, especially during spikes and pullbacks, makes them ideal for mastering breakouts, support/resistance, and supply/demand zones.
🔴 Disadvantages to Watch Out For
- Fast, Aggressive Moves
The same spikes that bring profit can also wipe you out — especially if you over-leverage or don’t use stop loss. Boom & Crash can be ruthless without discipline. - Can Trigger Overtrading
The 24/7 nature often tempts traders to chase setups nonstop. Without a routine or limits, burnout and revenge trading become serious risks. - No Real Market Anchors
Because they’re synthetic, there’s no underlying economy or fundamentals to help guide long-term direction. It’s purely technical — which can be both freeing and disorienting. - Fixed Minimum Lot Sizes
Unlike forex where you can go as low as 0.01 lots, Boom & Crash indices start at 0.20, making it harder to manage risk with very small accounts.
📘 Want to understand the full landscape of synthetic trading?
Check out our guide: Advantages & Disadvantages of Trading Synthetic Indices
🧠 My Recommendations
Boom and Crash indices might look slow or even predictable at first glance — but don’t be fooled. They’re not easy to master, and many traders still blow their accounts daily by overtrading or opening too many positions on small balances.
One of the biggest mistakes? Trying to guess when a spike will happen. That approach rarely works long-term. Instead, zoom out, study the broader market structure, and understand how the index behaves across timeframes.
If you take the time to really learn how these instruments move — build a strategy, manage risk, stay patient — they can be extremely rewarding. But if you rush in without a plan, Boom and Crash will drain your equity faster than you can react.
🎯 Focus on discipline, not prediction — and let the market do the rest.

🔗 Related Guides
FAQs On Trading Boom & Crash Indices
Boom and Crash are synthetic indices created by Deriv that simulate regular price spikes. Boom indices spike upward, while Crash indices spike downward.
Yes, you can start trading with as little as $5–$10. Just make sure to use proper lot size (0.20 minimum) and strict stop-loss settings to manage risk.
Boom 500 and Crash 1000 are ideal for beginners due to their moderate volatility and lower margin requirements compared to Boom 1000.
No. These indices are 100% synthetic and not influenced by economic news, interest rates, or global events. They move based on a secure random generator.
You can trade Boom & Crash on Deriv’s MT5 or cTrader platforms. Most traders use MT5 for charting and placing trades via a Financial Account

Other Posts You May Be Interested In
Deriv Copy Trading Review (2025): Is cTrader Worth It? ♻️
📅 Last updated: May 20, 2025 ✍️ Written by: Jafar Omar ✅ Fact-checked by: Munyaradzi [...]
HFM Demo Contest: Win Real Cash Prizes Without Any Risk 🎮
📅 Last updated: July 6, 2024 ✍️ Written by: Jafar Omar ✅ Fact-checked by: Munyaradzi [...]
XM Account Types Review (2024) ☑ Choose The Right One ⚡
📅 Last updated: December 6, 2023 ✍️ Written by: Jafar Omar ✅ Fact-checked by: Munyaradzi [...]
Exness Account Types Review 2024 🔍A Comprehensive Guide
📅 Last updated: May 8, 2025 ✍️ Written by: Jafar Omar ✅ Fact-checked by: Munyaradzi [...]
Synthetic Indices vs Forex (2025): Which One Is More Profitable for You?🍱
📅 Last updated: May 19, 2025 ✍️ Written by: Jafar Omar ✅ Fact-checked by: Munyaradzi [...]
AvaTrade Review 🔍: Is it the Right Forex Broker for YOU in 2024?
📅 Last updated: May 30, 2024 ✍️ Written by: Jafar Omar ✅ Fact-checked by: Munyaradzi [...]